Climate Change
MDGs and SDGs
MDG 7: ENSURE ENVIRONMENTAL SUSTAINABILITY
- Target 7.a: Integrate the principles of sustainable development into country policies and programmes and reverse the loss of environmental resources.
- Target 7.b: Reduce biodiversity loss, achieving, by 2010, a significant reduction in the rate of loss.
- Target 7.c: Halve, by 2015, the proportion of the population without sustainable access to safe drinking water and basic sanitation.
- Target 7.d: Achieve, by 2020, a significant improvement in the lives of at least 100 million slum dwellers.
SDG 13: Take urgent action to combat climate change and its impacts
Objectives
We lower our expectations for temperature increase reduction therefore we include adaptation because even if we meet them some will be affected:
- 13.1: Strengthen resilience and adaptive capacity to climate-related hazards and natural disasters in all countries.
- 13.2 : Integrate climate change measures into national policies, strategies and planning.
- 13.3: Improve education, awareness-raising and human and institutional capacity on climate change mitigation, adaptation, impact reduction and early warning.
Means
- 13.a : Implement the commitment undertaken by developed- country parties to the United Nations Framework Convention on Climate Change to a goal of mobilizing jointly $100 billion annually by 2020 from all sources to address the needs of developing countries in the context of meaningful mitigation actions and transparency on implementation and fully operationalize the Green Climate Fund through its capitalization as soon as possible.
- 13.b: Promote mechanisms for raising capacity for effective climate change-related planning and management in least developed countries and small island developing States, including focusing on women, youth and local and marginalized communities * Acknowledging that the United Nations Framework Convention on Climate Change is the primary international, intergovernmental forum for negotiating the global response to climate change.
Emissions and Global Warming
- In discussions on climate change, we tend to focus on carbon dioxide (CO2) — the most dominant greenhouse gas produced by the burning of fossil fuels, industrial production, and land use change.
- Total greenhouse gas emissions, however, are the sum of emissions of various gases: carbon dioxide, methane, nitrous oxide, and smaller trace gases such as hydrofluorocarbons (HFCs) and sulfur hexafluoride (SF6).
- Agriculture, fossil fuel production, and the management of waste are the primary sources of methane emissions.
- Most of our nitrous oxide emissions come from agriculture: N2O is produced when we apply nitrogen fertilizers to soils.
- Nitrous oxide is produced by microbes in nearly all soils.
- The same processes occur when we use organic fertilizers such as animal manure.
Compared to C02
- Methane is a much stronger greenhouse gas than CO2 in terms of its ‘warming potential’. Over a 100-year timescale, and without considering climate feedback, one tonne of methane would generate 28 times the amount of warming as one tonne of CO2.
- Methane is a very ‘short-lived’ greenhouse gas (12 years). It is removed relatively quickly from the atmosphere in contrast to CO2 which can persist in the atmosphere for centuries or even thousands of years.
- So reducing emissions here can be where we can make the most impact.
- Nitrous oxide is a much stronger greenhouse gas than CO2 in terms of its ‘warming potential’: one tonne of nitrous oxide would generate 265 times the amount of warming as one tonne of CO2.
- The average ‘lifetime’ of nitrous oxide in the atmosphere is around 121 years.
C02
- Carbon dioxide is the most important greenhouse gas, but not the only one. To capture all greenhouse gas emissions, researchers express them in “carbon dioxide equivalents” (CO₂eq).
- To express all greenhouse gases in carbon dioxide equivalents (CO₂eq), each one is weighted by its global warming potential (GWP) value.
- GWP measures the amount of warming a gas creates compared to CO₂. CO₂ is given a GWP value of one. If a gas had a GWP of 10 then one kilogram of that gas would generate ten times the warming effect as one kilogram of CO₂.
- Carbon dioxide equivalents are calculated for each gas by multiplying the mass of emissions of a specific greenhouse gas by its GWP factor.
- This warming can be stated over different timescales. To calculate CO₂eq over 100 years, each gas is multiplied by its GWP over a 100- year timescale (GWP100).
GWP & emissions by gas
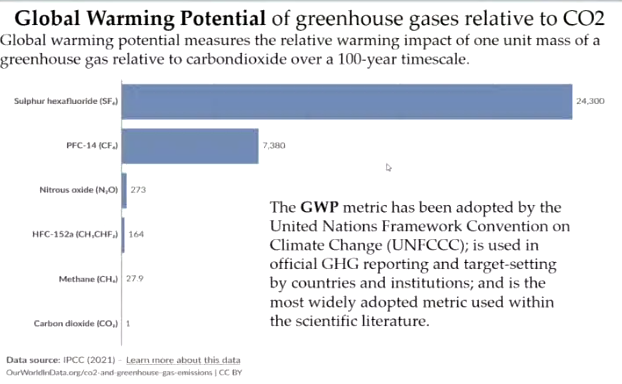
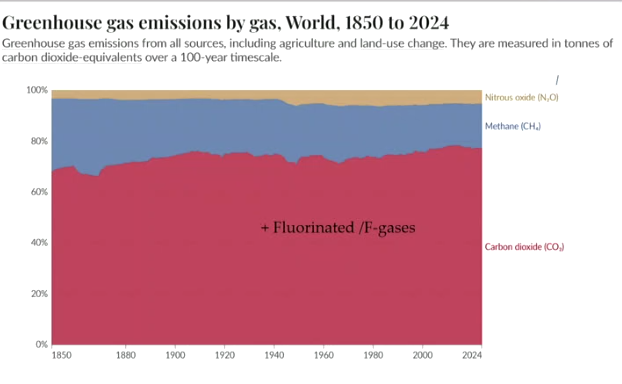 Evolution to some extent explained by the move from agriculture to industry.
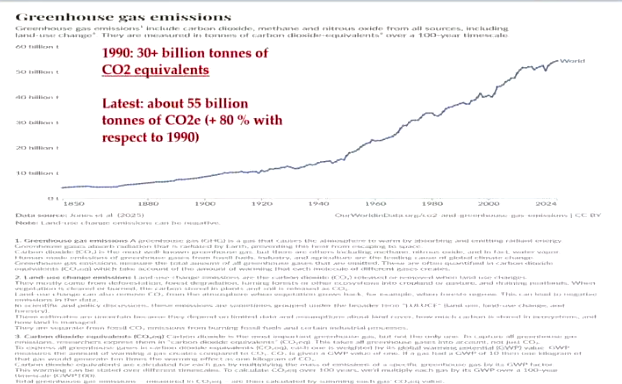 On the rise.
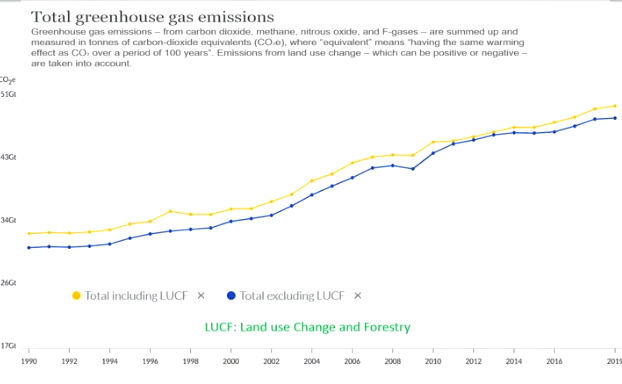 Variance due to deforestation.
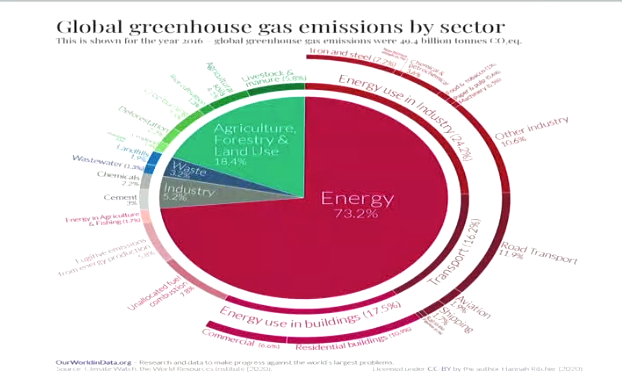
By sector
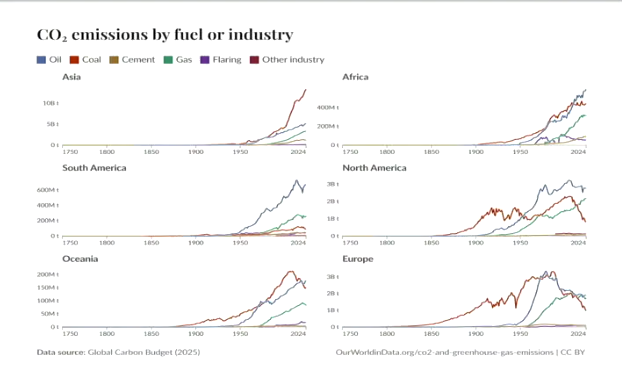
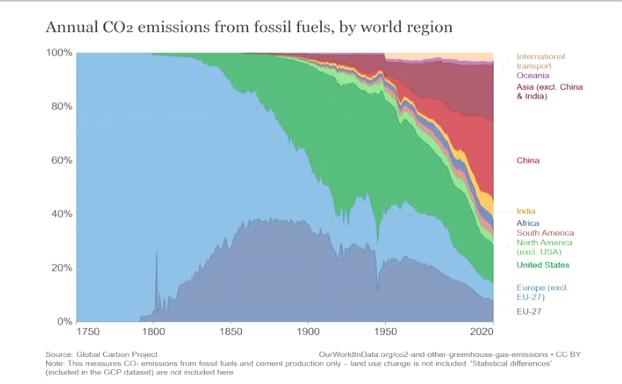 We can see the industrial revolution arriving to different regions.
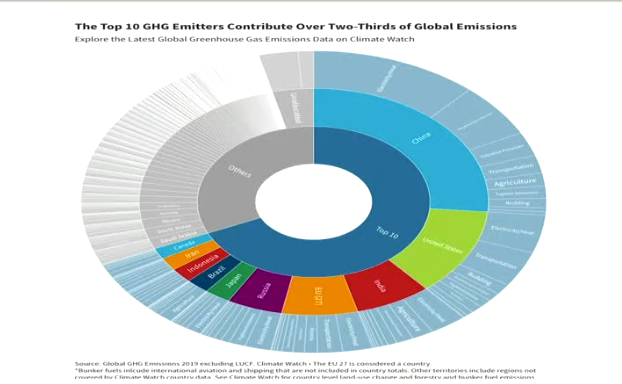 US, China, EU, RSS, Brazil, Asia, Canada… They make up a lot.
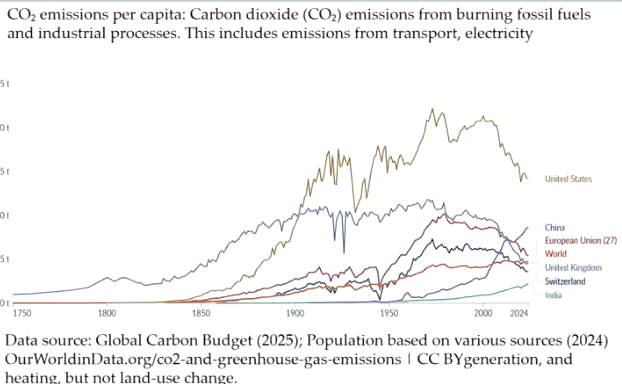 China big but way below USA.
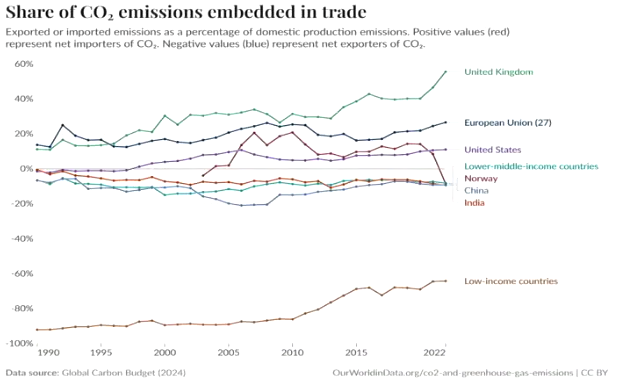 Important to look at everything like here, not only consumption. Some export (negative) and others import (positive) the emissions.
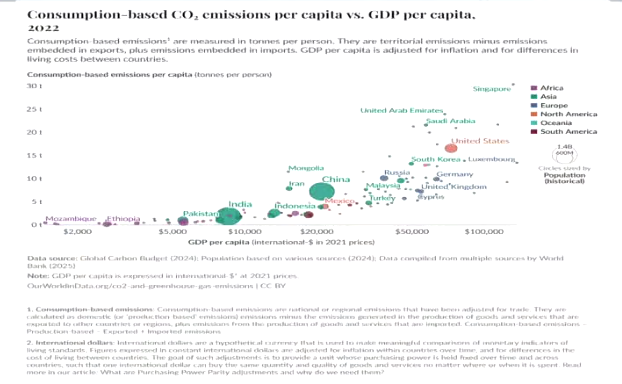 Basically as a share of domestic consumption, but we remove exported emissions and add imported ones. Having green tech for domestic production is good but you also have to take into consideration that you may be importing goods with high emissions, because all countries haven’t yet implemented such green production techniques. Basically related to the concept of pollution havens.
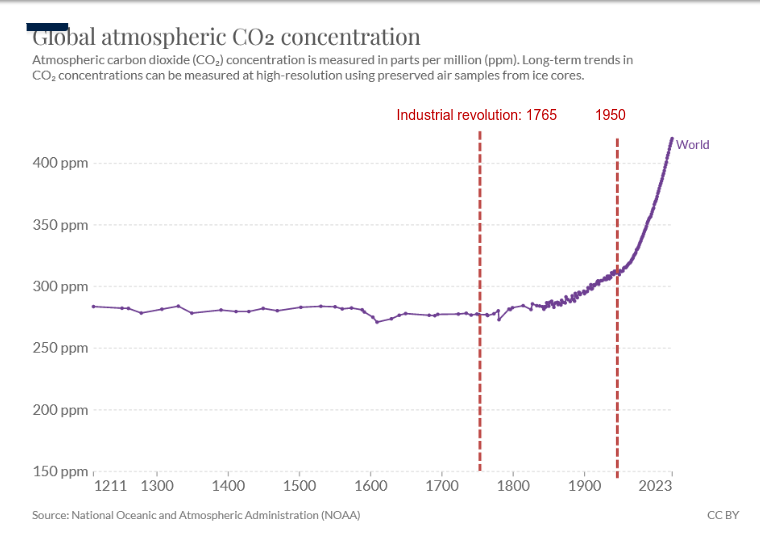
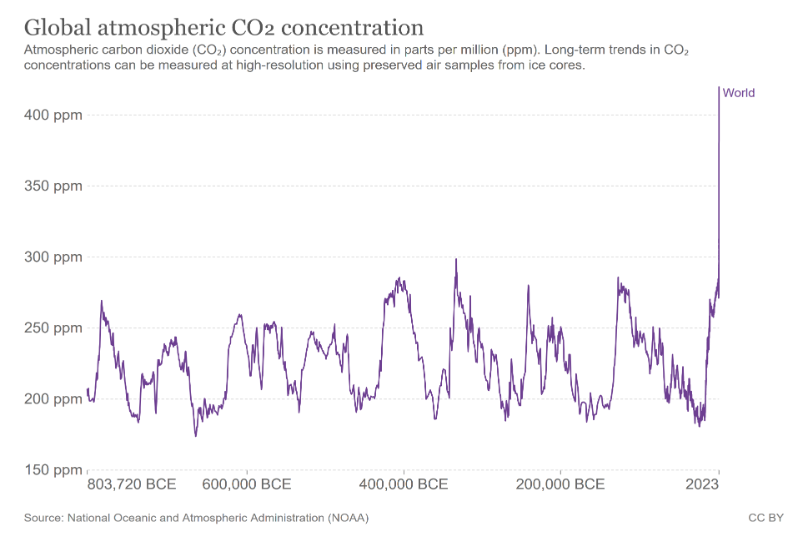 We have already had high concentrations in the past because of natural things but never as high, considerable difference.
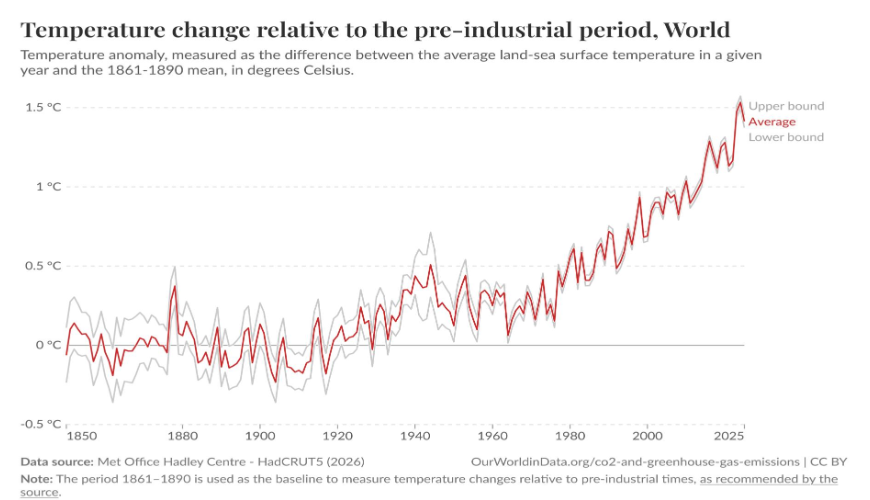 Big temperature change as well. Same reasoning.
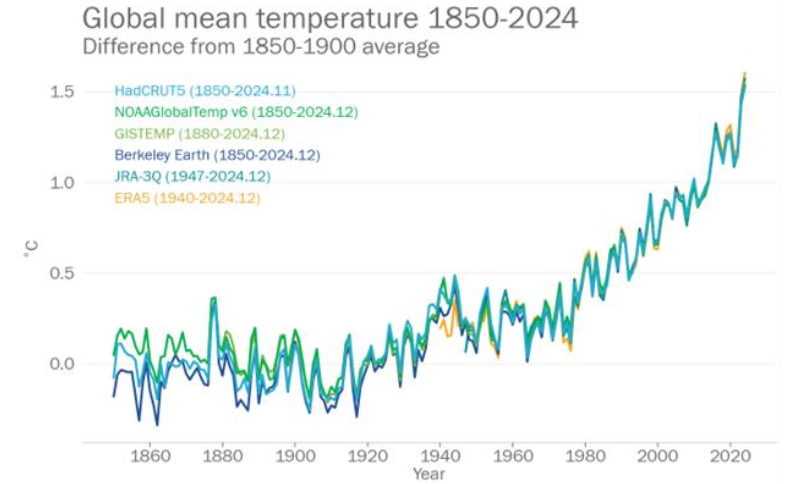 Strong correlation with the increase of C02 concentration in the atmosphere as we can see.
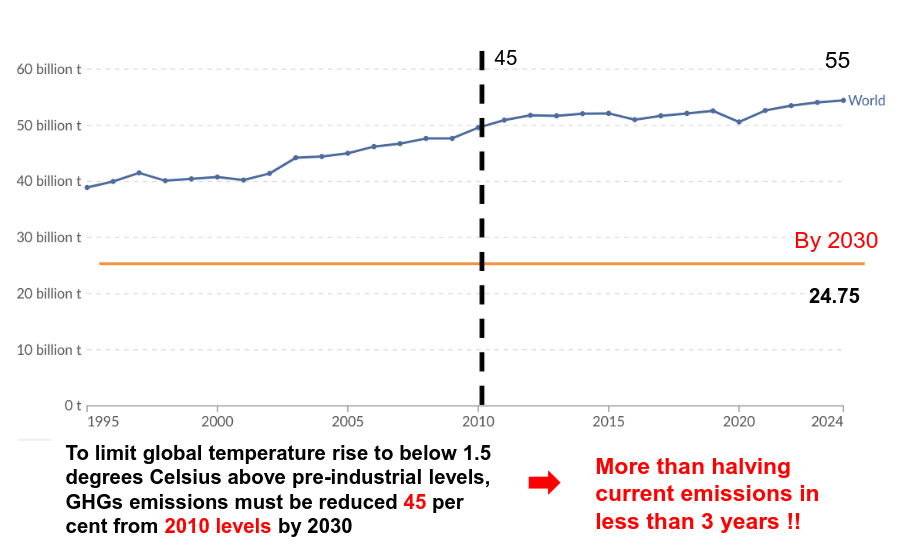 Should we want to respect the 1.5 Cº maximum rise we’d have to halve our emissions in less than 3 years.
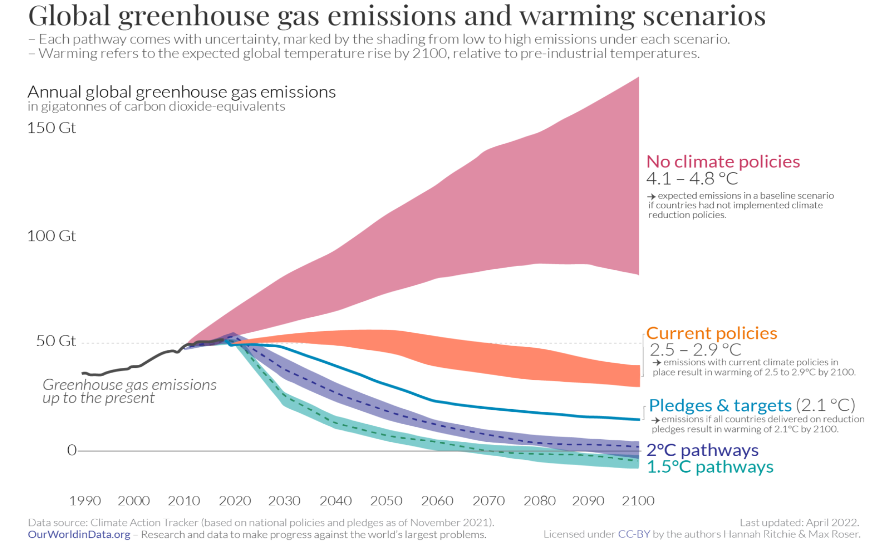 Unlikely that we make it.
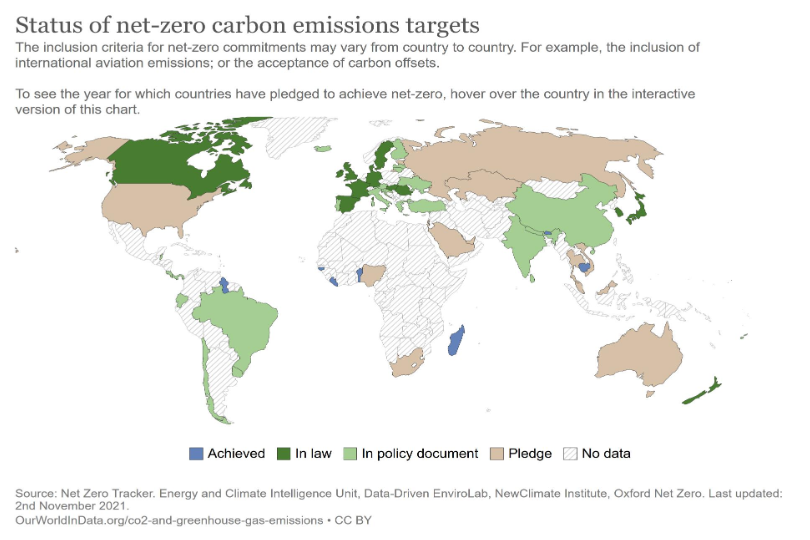 Little achievement, mostly a policy objective or a pledge, if anything.
Pricing Carbon
- Creation of the Club of Rome in 1968 and publication of its first report (the Meadows report: “Limits to growth”) in 1972.
- 1979: First World Climate Conference (WMO) “The conference noted that there was an additional issue of special importance: the problem of possible human influence on climate.” (In foreword by D. A. Davies, WMO SG).
- 1988: The WMO and UNEP establish the Intergovernmental Panel on Climate Change (IPCC).
- 1994: The United Nations Framework Convention on Climate Change (UNFCCC) enters into force.
- The IPCC stated clearly in its fifth assessment report (2014) : “Anthropogenic greenhouse gas emissions have increased since the pre-industrial era, driven largely by economic and population growth, and are now higher than ever. This has led to atmospheric concentrations of carbon dioxide, methane and nitrous oxide that are unprecedented in at least the last 800,000 years. Their effects, together with those of other anthropogenic drivers, have been detected throughout the climate system and are extremely likely to have been the dominant cause of the observed warming since the mid-20th century.
Why price?
- Climate change is a clear case of a negative externality as the economic transactions that contribute to the enhanced greenhouse effect adversely impact the utility of future (+current) generations through a degraded environment (+ possible contemporaneous health effects).
- Putting a price on carbon emissions should, in theory, make emitters internalize the cost of the damage caused and reduce their levels of emissions.
- Paid by the consumer or the producer. If producers can’t compete with others (like foreign corporations not subject to these prices) they disappear.
- The price of carbon should reflect the Social Cost of Carbon (SCC), which, from a conceptual point of view, corresponds to the optimal CO2 price that maximizes the net benefit to society (i.e. the social benefit minus the social cost of CO2 emissions).
- See the detailed economic foundations of the SCC.
How to calculate?
Two key elements determine the SCC:
- The set of damages expected from global warming: projections are based on several parameters reflecting the effects of emissions on temperatures and other climate impacts, and the impacts of climate change on the economy and human welfare.
- The discount rate applied to damages directly affects the value of net benefits: it reflects the society willingness to trade immediate benefits (i.e. not paying the costs) for future ones.
- High discount rate: lower value of benefits to be enjoyed in the future: weak climate mitigation policies.
- Low discount rate: stronger commitment to mitigate climate change today.
Representing the SCC
- Common textbook representation of the SCC involves a curve representing marginal damage (DD) and one representing marginal abatement cost (BB).
- DD is upward sloping to reflect the fact that the negative impact of emissions increases with their level. This is consistent with both current and cumulative emissions impacting climate with higher effects for higher levels of accumulated emissions.
- BB is downward sloping to reflect that it is increasingly costly to reduce emissions as it could require, for instance, investment in increasingly onerous low emission technologies.
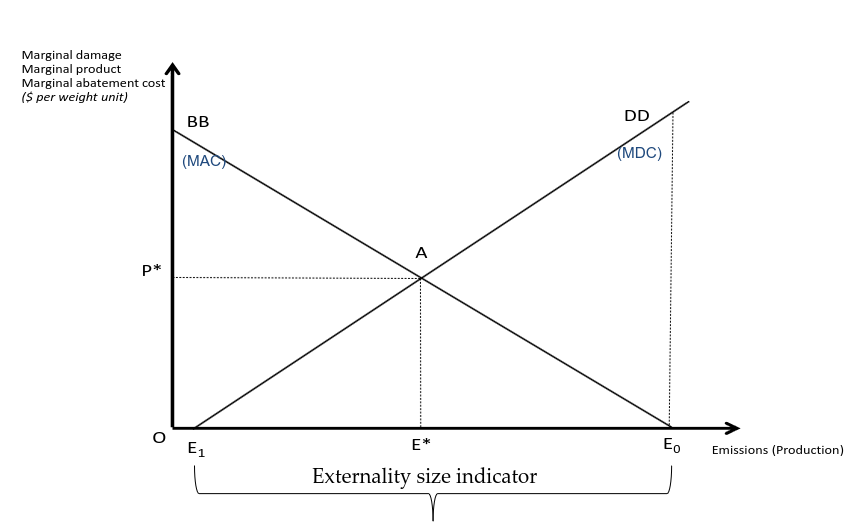
No consensus
- In the absence of policy an excessive level of emissions from a social standpoint is expected.
- With perfect information about abatement costs and social damages a central authority would be able to identify the socially optimal level of emissions and impose it using the most appropriate carbon pricing mechanisms.
- In practice, the determination of an optimal carbon price involves the use of complex assessment models that capture feedbacks between the economy and the climate.
- Two major strands in the literature have emerged:
- One supports strong discounting and rather weak SCC (around US$40- 60 per tonne) .
- The other would favor the inclusion of a larger set of elements in the damage assessment but would also apply a lower discount rate (the resulting SCC could be as high US$ 300).
Implementing
- Growing consensus on the core role to be played by carbon pricing in the transition to a decarbonized economy ( however, it is also recognized that it could not be the only instrument of climate policy).
- Standard instruments: Pigouvian taxes (i.e. carbon tax) or subsidies.
- However, implementation may not be politically popular (e.g. gilets jaunes movement in France).
- People even compensate for taxes, so it doesn’t cost them that much… but still impopular.
- Large set of policy instruments to price carbon (implicitly or explicitly) + non-pricing instruments.
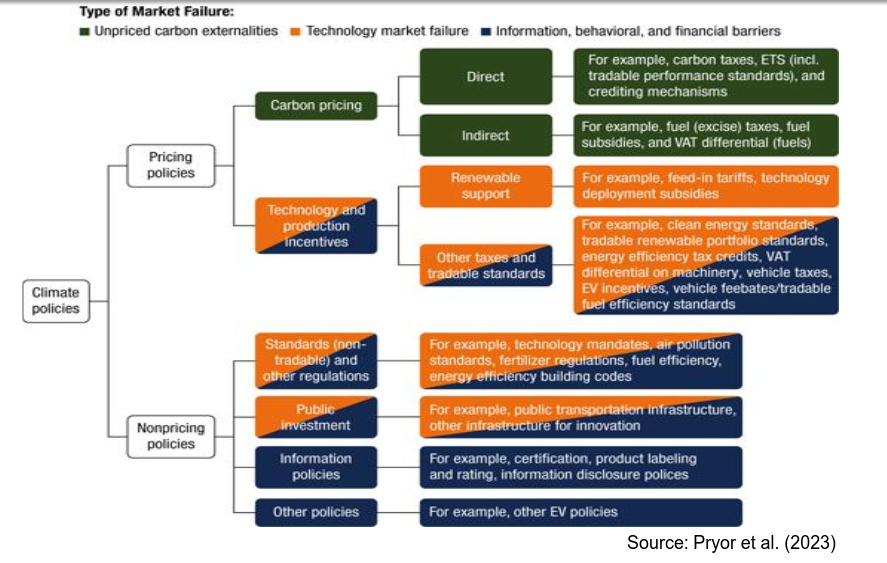
Cap-and-trade systems
ETS: cap-and-trade systems in most cases
- a cap or absolute limit on the emissions is defined within the ETS and emissions allowances corresponding to that cap are distributed (allowances can be distributed either for free or through auctions).
- allowance credits can be traded among emitters in a dedicated regulated market ⇒ market price for GHG emissions.
- NB: Sectoral coverage is still partial in most cases.
- Offsets: compliance (run by governments: Clean Development Mechanism and Joint Implementation) or voluntary (run by NGOs) programs.
- ⇒ essentially baseline-and-credit systems:
- baseline emissions levels are defined for individual regulated entities and credits are issued to entities that have reduced their emissions below this level;
- these credits can be sold to other entities exceeding their baseline emission levels ⇒ market price for GHG emissions ;
- credits (from compliance and voluntary programs) may be used in ETS.
- Result-based carbon financing
- financing modality under which funds are disbursed by an investor or donor to a recipient upon the achievement of a pre- agreed set of results related to managing climate change, such as emission reductions.
- some RBCF programs purchase compliance emission reduction units.
Other methods
- Taxes (subsidies): explicit (i.e. carbon tax) or implicit (e.g. excise tax on gasoline)
- Indirect vs. direct effects on gov revenue.
- can be efficient (i.e. net social benefit maximised) and cost-effective (i.e. environmental target reached at lowest cost) when information about social damage and firms’ emission abatement costs is complete;
- but not necessarily fair + impact on production composition and prices (international competitiveness).
- Carbon border tax: carbon taxes imposed on carbon intensive imports that have not been carbon-taxed at source.
Border adjustment
- A major motivation for using a carbon border adjustment is the reduction of “carbon leakage”: the relocation of production to countries with less constraining climate policies, giving rise to pollution havens and undermining global climate objectives.
- By raising the price of imported goods a carbon adjustment tax act as a price equalizer and de facto limit unfair competition from goods produced in locations with weak environmental policies.
- As a price on carbon, a carbon adjustment tax affects GHG emissions.
- However, as a trade-related measure, it affects production and exports like any tariff.
Coverage
- In 2025, carbon pricing initiatives cover 14.7 gigatons of CO2e, which is equal to 28% of global annual GHG emissions. (High inc.:27%; Middle inc.: 30 %; Low inc.:0%).
- In 2022, altogether these initiatives would cover 12 GtCO2e, representing 23% of global GHG emissions.
- Of the 80 carbon pricing instruments implemented as of 2025, 37 are ETSs, mainly across subnational jurisdictions, and 43 are carbon taxes, primarily implemented at the national level.
- First carbon pricing initiatives: carbon taxes or alike Finland, Norway and Denmark introduced in the first half of the 1990s.
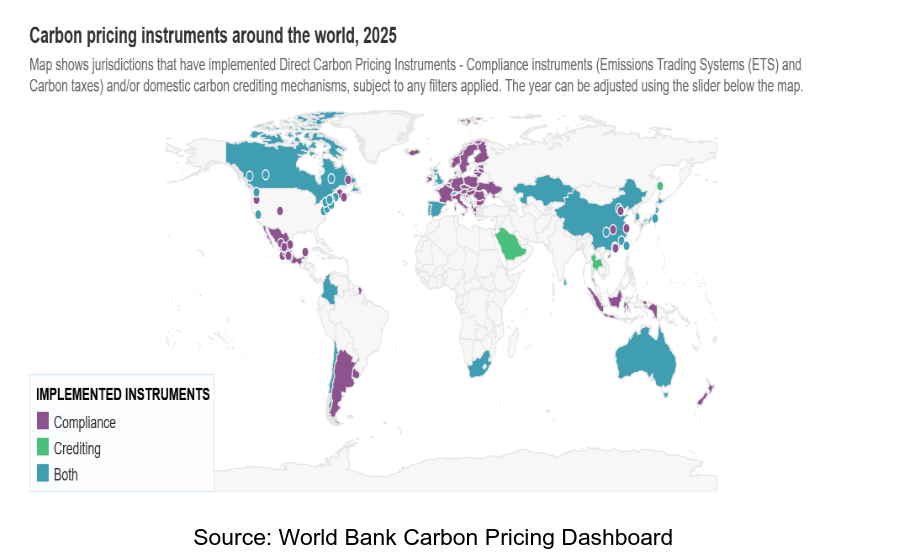
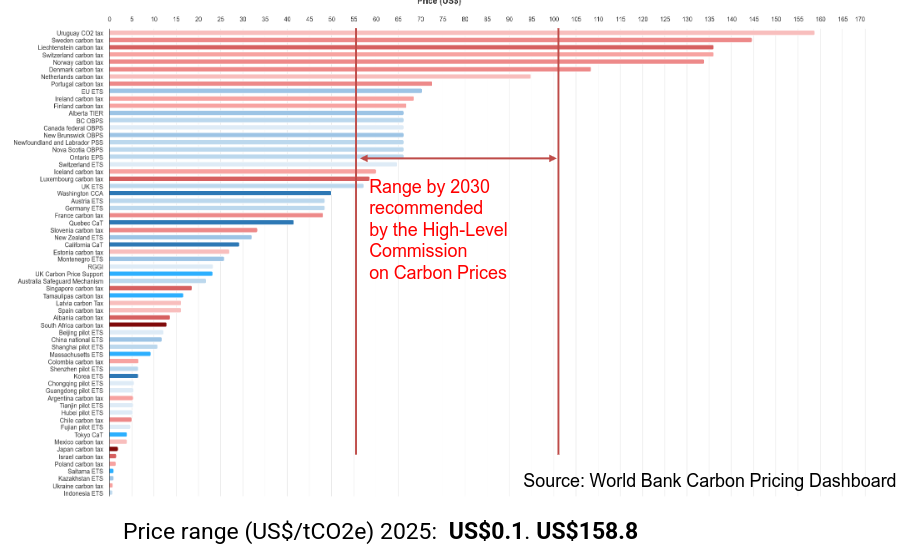 Too diverse. Taxes might be easier than cap-and-trade, some countries have too high of a cap: no demand.
So how to price? Considerations
- What should be the price of carbon? Is there a unique optimal price?
- Likely to vary across sectors and countries (result from basic economic analysis as soon as several firms or countries are included).
- Lack of price convergence: arbitrage leading to leakage is certainly occurring.
- Information is far from being complete: abatement costs at the firm/industry level are subject to uncertainty and asymmetric information.
- Incomplete information could lead to inefficient policy action: e.g. allowances in ETS may be overestimated. ⇒ oversupply of emissions credits and price collapses.
- Existing carbon policy biases must be taken into consideration when implementing carbon pricing initiatives and climate change policy in general:
- For instance: emissions-agnostic tariff systems of most nations already have a carbon bias, and it favours dirty goods: tariffs on raw materials tend to be much lower than those on processed goods, and that those raw material inputs are generally muchmore carbon intensive.
- Estimates (Shapiro QJE 2020) suggest that the bias against cleaner goods equates to an implicit subsidy of the dirtier goods of typically 120 per ton of CO2.
- Environmental objectives in using carbon border policy instruments should prevail over competitiveness ones.
- Avoid trade wars which can be detrimental to climate change action.
- Preserve compatibility with GATT/WTO rules.
- Multiplicity of instruments: net effects (environmental and economic) not easy to assess.
- Partial equilibrium effects may lead to cost-effectiveness and efficiency considerations that would have to be reconsidered when general equilibrium effects are accounted for.
- The issue of climate-related stranded assets (natural resources, infrastructure and industries) is likely to become a highly contentious one in the years to come.
- For instance, at least 33% of oil, 49% of gas and 82% of coal reserves would have to be kept underground.
- International cooperation and coordination are complex political processes (“free rider issue”) as respective responsibilities are difficult to establish in a time consistent framework (e.g. changes in political leadership + vested interests).