International Trade
MDGs and SDGs
In the MDGs framework trade was confined to Goal 8 (develop a global partnership for development) and mainly referred to as a matter of market access and tariff reduction.
- 8.A: developing an open, rule-based, predictable, nondiscriminatory trading and financial system.
- target 8.B: providing LDCs with enhanced market access to their exports, via tariff-free and quota-free market access, with a view to addressing their special needs (target 8.B). Both targets may be considered unfinished business of the Millennium Development Goals. The rationale for developing further an open, rule-based, predictable, non-discriminatory trading system was not explicit except that of promoting trade.
In the context of the post-2015 development agenda, international trade is presented as an enabler for achieving a broad range of development goals through promoting inclusive and sustainable economic growth.
- When properly harnessed, the opportunities brought by international trade can be a powerful force for creating jobs, enabling efficient use of resources, providing incentives to entrepreneurs and ultimately improving standards of living in all countries.
- Trade can be good, only under certain circumstances. There is no framework to discover exactly which but basically winners and losers need to be reconciled.
Targets
There are about 20 targets in different SDGs that are related to international trade.
- These trade-related targets can be classified into two groups: one that addresses an institutional framework, i.e. the multilateral trade rules under the World Trade Organisation: for instance→
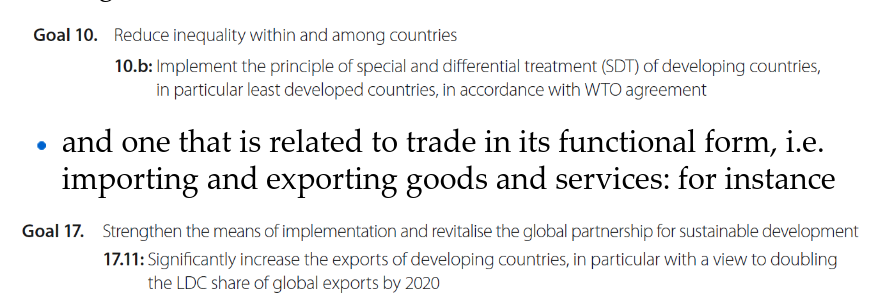 No general agreement in the WTO since 2021, not good. Far from reaching goal 17, might not even be reached by 2030 even.
International Trade
- World trade = Sum of exports from all countries OR Sum of imports to all countries.
- Exports are in free on board (fob) units.
- Imports are in cost of insurance and freight (cif units) cif value/fob value = transportation costs (≠ terms of trade).
- In many cases imports are better measured, for tariffs.
- There are asymmetries, you don’t necessarily export where you import from… you normally export and import different things and don’t trade with yourself unless in very weird cases so things aren’t counted twice.
- Country trade= sum of imports + sum of exports recorded at the country level.
- If data was perfect we could get info from flows cif (importing countries) and fob (exporting countries) and they’d match. They equal transportation costs, not terms of trade.
- There are countries that declare both, most reliable source to compute transport costs.
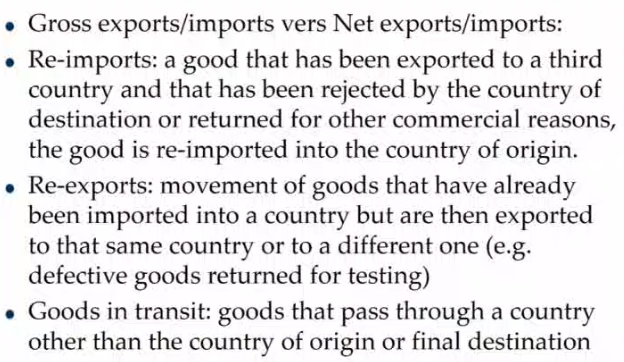
- Re-imports (partially consumed good for military forces f.ex) and re-exports often not well reported, why we stick to gross data.
- Good in transit and re-exports/imports not the same thing specially in registration! Sketchy stuff in US tariff avoidance and etc.
Graphs
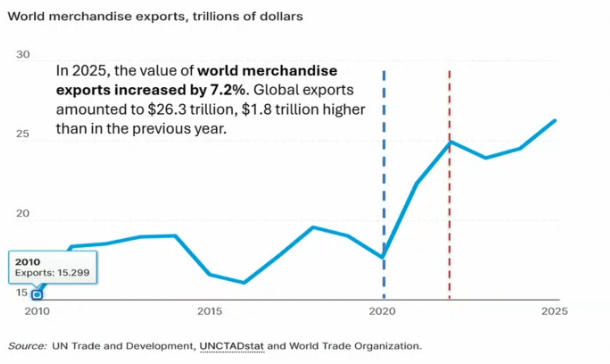 In 2025 26+ trillion USD (Nominal value) exports and 110+ trillions GDP. Collapse in 2020, events affect it obviously. Second vertical line is 2022 (crash from Ukraine war). Hormuz will probably impact it as well even though projections show resilience, they are not always reliable. Important data.
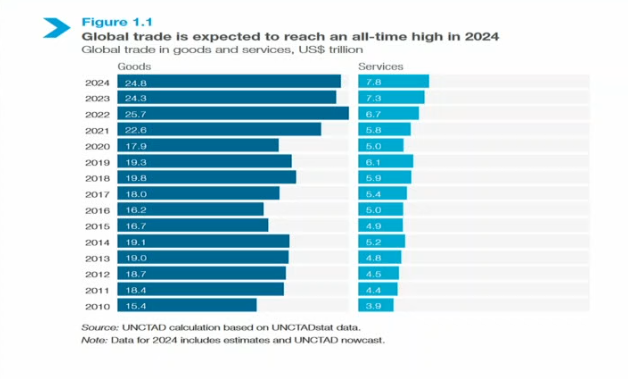 Trade is by default trade in goods otherwise global trade in services is explicitly named, which is not as frequent. Trade in services aren’t final financial transactions at the border, most are electronic even. Most data doesn’t get to 2025, but is desagregated for 2024. 2025 and 2026 are not comprehensive yet. Trade in goods remains predominant but loses ground to services.
Services are about a third of global trade and it’s increasing.
Good classification (codes)
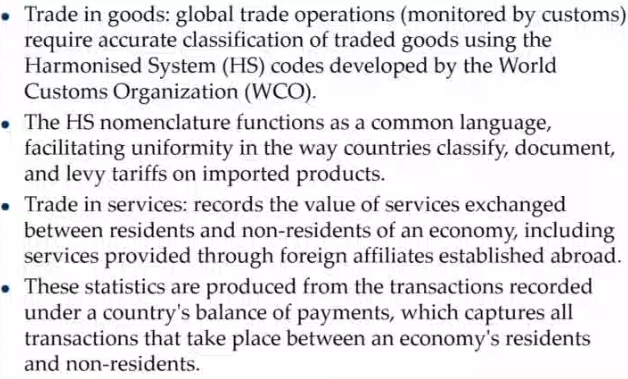 6 digit system that each country can extend. When beyond the 6 digits it varies a lot, can’t be made compatible inter country because of lack of organisation ruling it.
For services we don’t have that, WTO meets regularly in committees and sub committees so it’s a dynamic process but also long. New version of the nomenclature for goods every year from state negotiation but none for services at custom. There is no process at border but data comes from national accounting at the payment balance. Even then they are not that classified. Not as much data available.
They are governed by the GATs though:
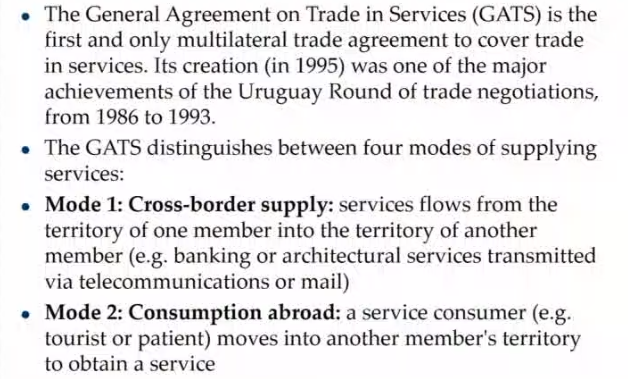
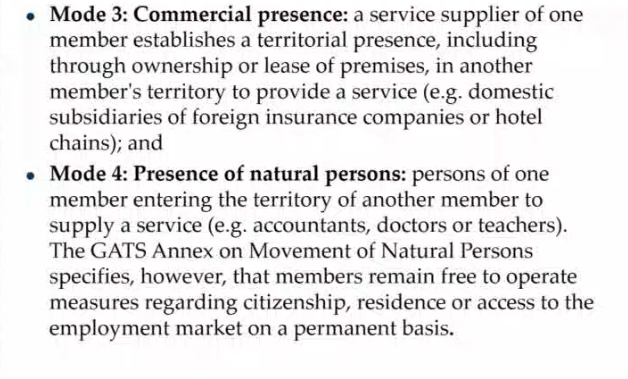 Mode 3 is FDI and 4 temporary worker movement which countries can limit e.g.
Main actors
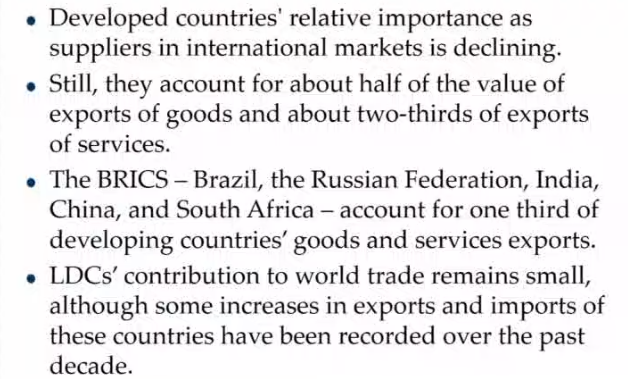 Developing countries growing but far from SDGs targets because of reasons like exposure to climate change.
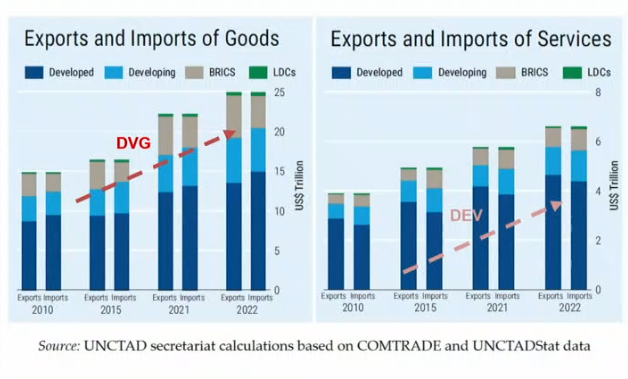 DVG improve in some but developed dominant specially in services.
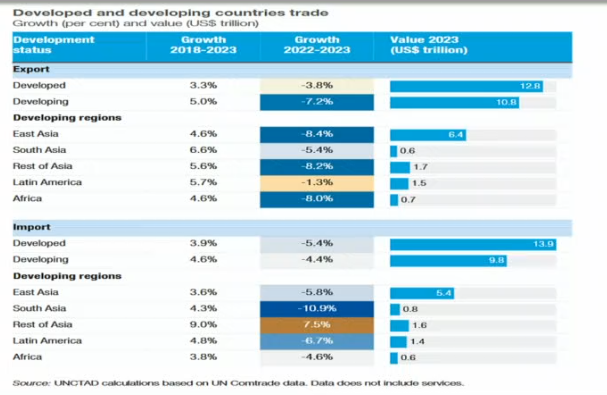 Can see how global shocks like the war in Ukraine impacted some countries. Trade in merchandise for some countries has gone quite down. The surplus of one is the deficit of another, although this isn’t always true for every sector (if we look only at one sector this can look inconsistent but is isn’t).
Non-nominal measure
Nominal reflects inflation→artificial higher value if supply-demand forces don’t correct… and same quantity.
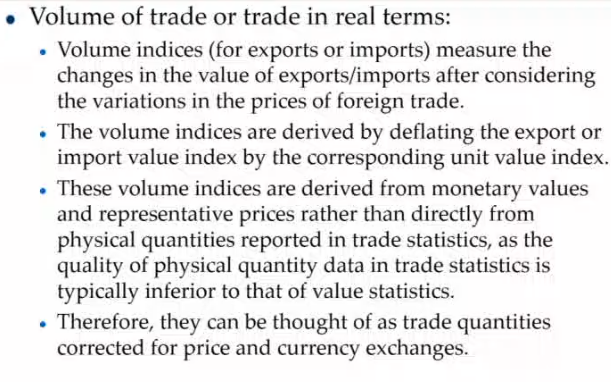 Therefore it can be useful to use volume, which can be used for every type of goods. We can express them using a reference year for prices (CPI, GDP deflator, etc… depending on the statistic) so as to remove inflation influence. It is expressed in nominal values like USD so it is necessary to be careful about how value changes in the nominal exchanges affect this reading. Many dimensions are important to analyse these things correctly.
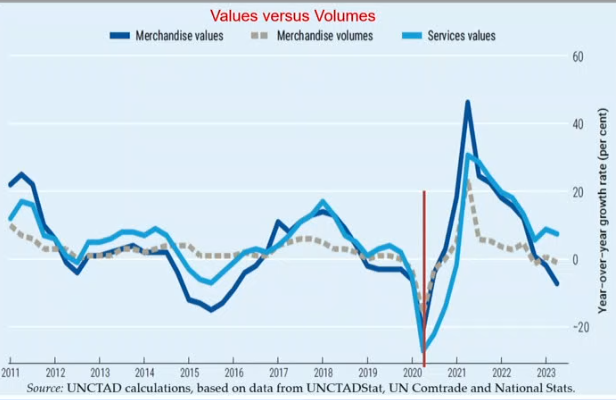 Nominal communicates more but isn’t always the truest. We can see that prices are more volatile than volume.
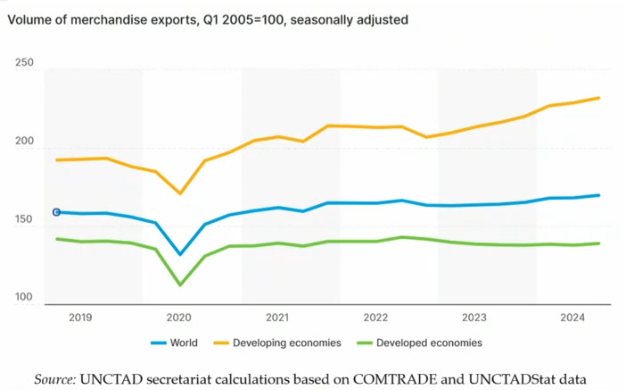 COVID had an impact no matter the measure.
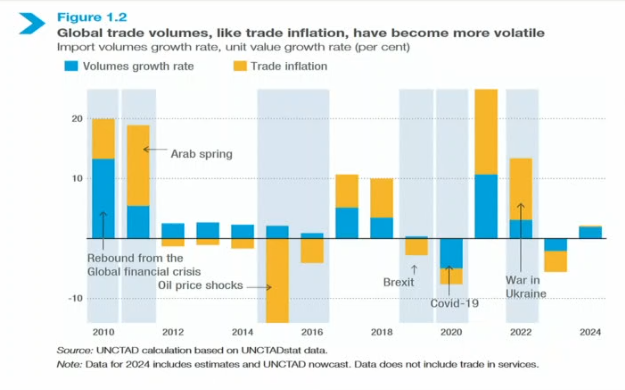 There are shocks to elements used in production processes like in the case of the oil price shocks; among other phenomena.
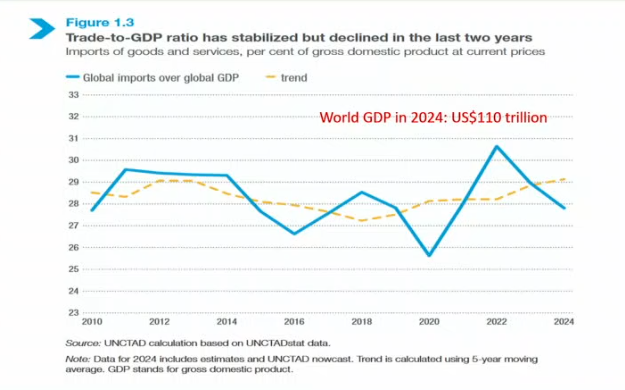 2 thirds of global GDP is domestic production. Volatility caused by changes in prices across countries. We don’t normally use the same GDP deflator for trade and GDP so representations will probably differ.
Terms of trade
- The terms of trade or “net barter” terms of trade is the ratio of the export unit value index to the import unit value index.
- As a simple example, if a country imports product X and exports product Y, and the price of X increases and that of Y decreases, then their terms of trade worsen over time, as for the same amount of exports it can purchase less imports.
- The purchasing power index of exports, or “income terms of trade” is the value index of exports deflated by the import unit value index.
- Better measure.
- Prices can decrease but power might not, not necessarily.
- This indicator is an alternative or complement to the net barter terms of trade: if a country increases its exports significantly, this can sometimes negatively affect the price of those exports, and thus while its net barter terms of trade worsen, increased value from exports improves its income terms of trade vis-à- vis its imports, which is what this indicator measures.
- Exporting allows/helps to import, an incentive to trade beyond the returns of exports.
- You can also do it using loans but that’s not the best approach, risky.
- If you export a lot because of your efficiency you may reduce price (supply & demand laws) but you may also sell more.
Evolution
- In 2024, the terms of trade declined by 1.1% in developing economies driven by a 2.2% deterioration in developing economies Asia and Oceania.
- By contrast, developed economies saw a moderate gain of 0.6% from the previous year.
- Among developing regions, the most significant improvements were observed in developing Africa and developing Americas registering 4.7% and 2.9% increases, respectively.
- Least Developed Countries recorded the highest improvement in 2024 with 5.1% increase compared to 2023.
- Most are African.
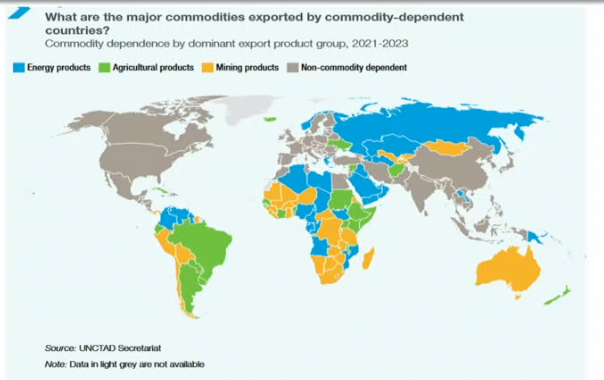
- Most developing countries export commodities like oil or other extractive resources.
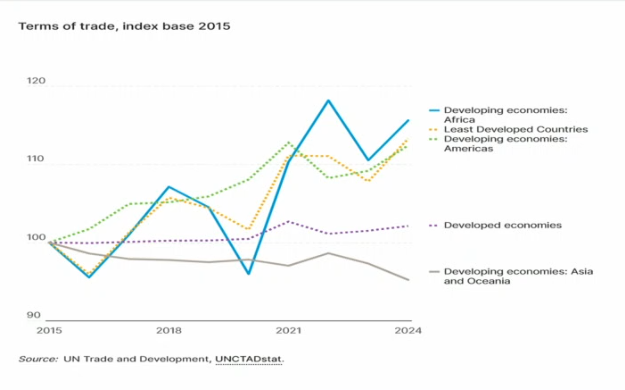 Slight improvement for developed and big for developing. Asia and Oceania going bad reflected in aggregated value of developing economies and the incidence of exports such as those of China and India (very important) explain this.
Share by type of goods
- In terms of value, a large amount of world trade relates to chemicals, communications equipment, machinery, motor vehicles, metals and energy products (oil, gas, coal and petroleum products).
- In contrast, light manufacturing sectors, including textiles, apparel and tanning, comprise a much smaller share of world trade.
- Agricultural sectors – which include food, vegetable and animal products, as well as oils and fats, and tobacco and beverages – accounted for a total of about US$2+ trillion of trade flows in most recent years, or less than 10 per cent of international trade.
- Doesn’t mean that this would reflect in the labor force, some things just aren’t that exported. In developing countries many still work in agriculture f.ex.
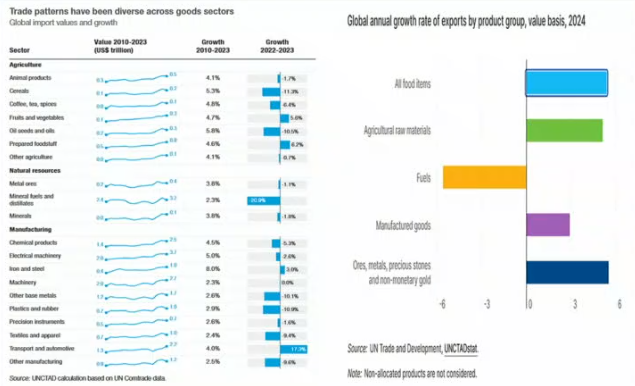 Could explain geopolitical tensions that have driven recent events.
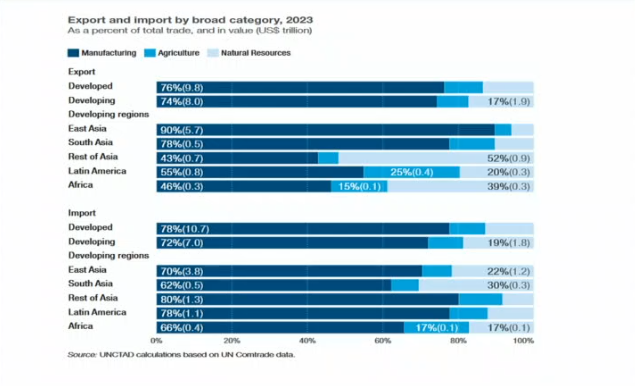 Manufacturing is high added-value goods. Big contrasts like Asia and Africa. Developed manufacture a lot (but developing like China are catching up but still more present in market of natural resources (not china tho)), import a lot of agriculture. Value addition is not homogeneous.
Non-final goods are now a big part of trade.
By type of country
- Developed countries account for the bulk of world trade, both in terms of goods differentiated by stage of processing and broad category.
- Besides other developing country regions, a significant amount of trade is linked to BRICS, especially in relation to the trade of intermediates and manufacturing.
- They also tend to import few consumer goods whilst exporting a relatively large share.
- Developing countries tend to export more natural resources than they import, which is the opposite of developed countries.
- LDCs only represent a small share in all types of goods, with a larger share in the exports of primary products and the imports of manufacturing goods.
- Developing economies registered a significant decrease in their trade surplus in 2023 compared to the previous year.
- Their trade balance stood at 654 billion in 2023.
- At the same time, developed economies saw a decreased merchandise trade deficit in 2023 of $1.1 trillion.
⇒ The developed world’s imports decreased more than their exports.
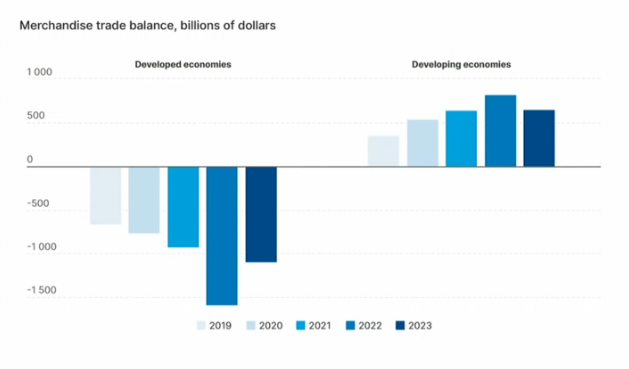 Deficit increased now it’s going down.
By service sector
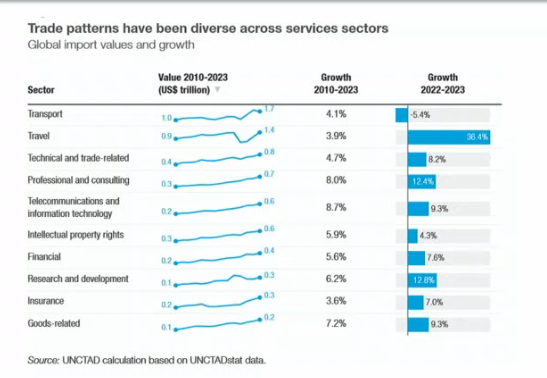 Big travel (tourism) growth.
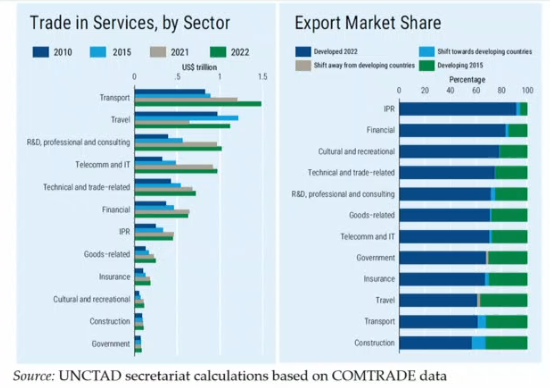
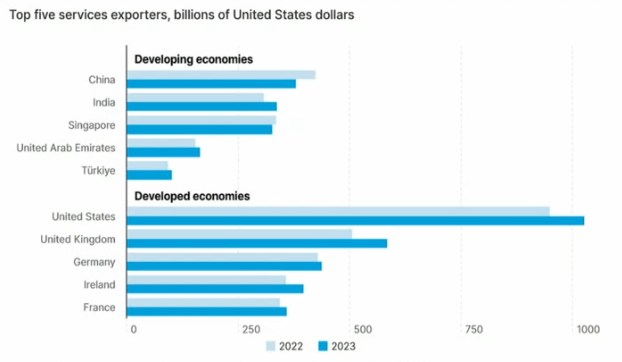
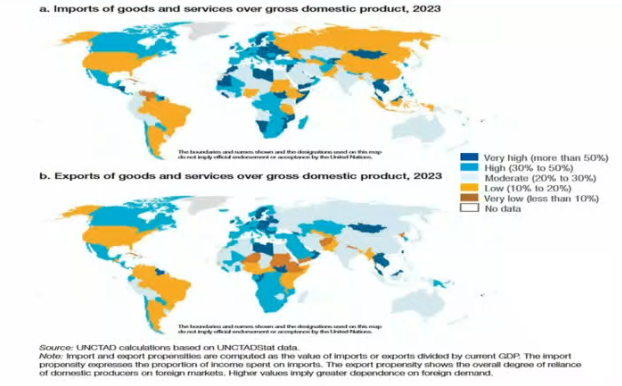 Using ratios of GDP is a better measure than absolute values. Some are just active in imports/exports or both. In Europe we trade regionally a lot, explains the map.
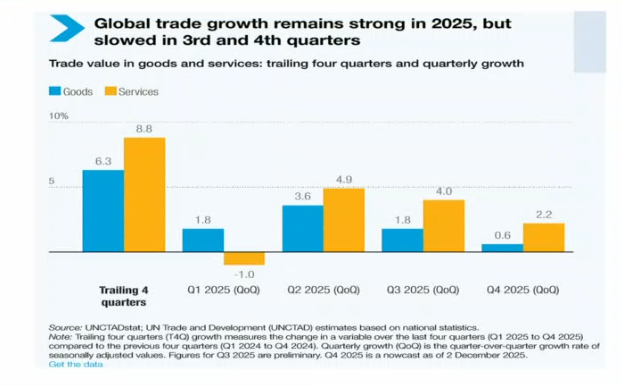 Lots of resilience but it might change for 2026 despite predictions. In 2024 there was more than in 2025 already.
Increase
- The increase in world trade during the last two decades has largely been driven by the rise of trade between developing countries (South–South).
- By 2014 the value of South–South trade had reached almost US$ 5 trillion, a magnitude close to that of trade between developed countries (North–North).
- Despite the trade slumps in 2009, 2015 and during the COVID-19 pandemic of 2020, the share of South-South trade in global trade continuously increased from around 17 per cent in 2010 to about one fourth in recent years.
- Other developing countries markets become a major export destination for most developing countries South South trade remains mainly driven by trade with China.
- Also a lot of offshoring to China by Europe.
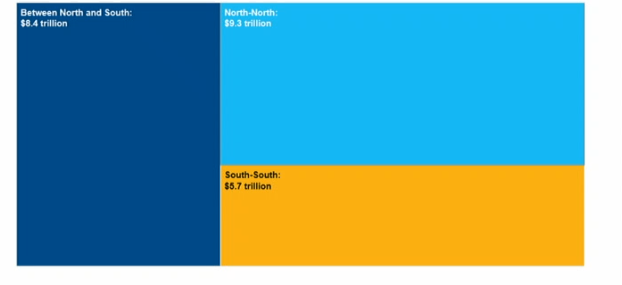
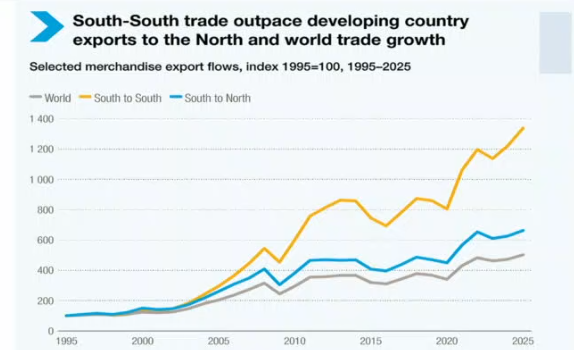
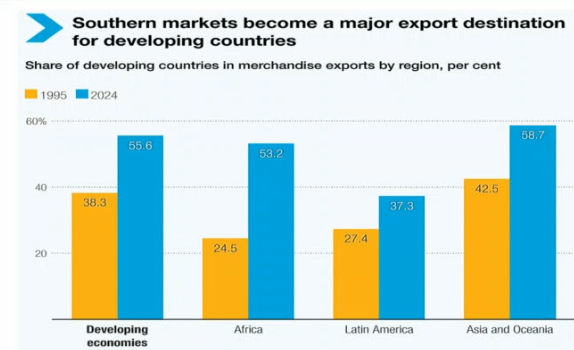 This is in value terms, we should use volume. Importance of Africa has greatly increased.
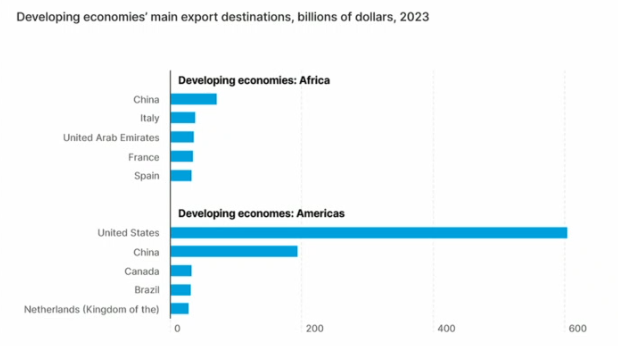 Bias more towards natural resources than agricultural goods for African (developing) exports. China present in both. Same logic for American countries (developing).
Commodity dependent
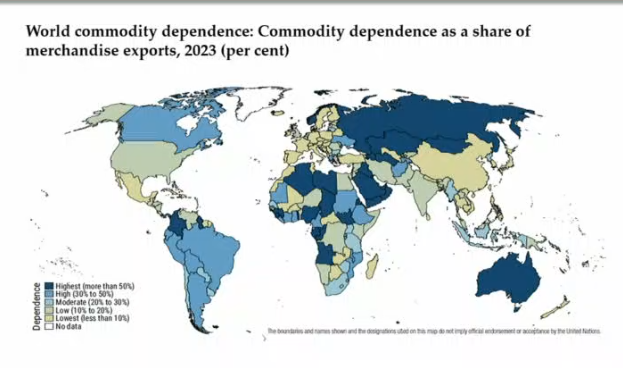 We consider it to be dependent if it’s more than 60%, some are dependent and not developing (e.g. Norway or Australia).
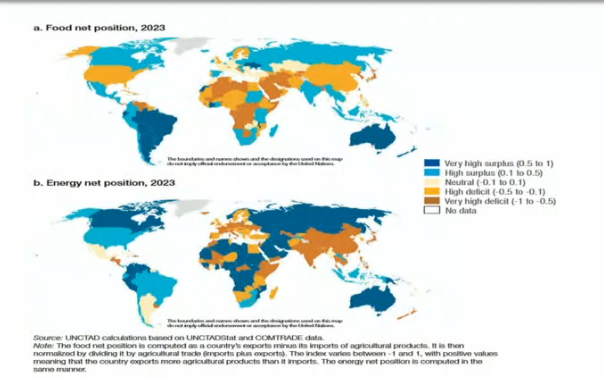 Price of food products are expected to rise a lot very fast very soon, importers will lose and exporters will gain purchasing power. Like with oil, your net position in strategic goods is important when trying to control prices. Either way, sometimes you just can’t (USA exports oil and prices have still gone up→global prices matter/exist for some cases).
There can be a correlation between commodity dependence and food import dependence, when this happens you suffer double the vulnerability. Food insecurity can come from conflict, could happen soon (price rise) because of war in the ME and oil prices being disrupted. Some possible development consequences of commodity dependence can be examined through the resource-curse perspective.
Trade policy instruments
Some countries affected by tariffs right now and could put bans on their exports. Subsidies have a similar effect, considered a non-tariff measure. These policies can be per sector f.ex.
By type of country
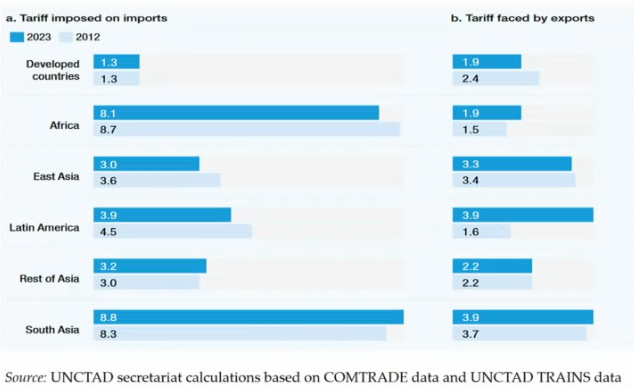 We see the developed haven’t changed import tariffs much, unlike those they face when exporting. These differences between groups could be because the developed use more non-tariff measures which explains also why they face export costs. SA and AF specially don’t use them as much. This doesn’t necessarily mean that the developed are protectionist.
Global average and consequences of US tariffs
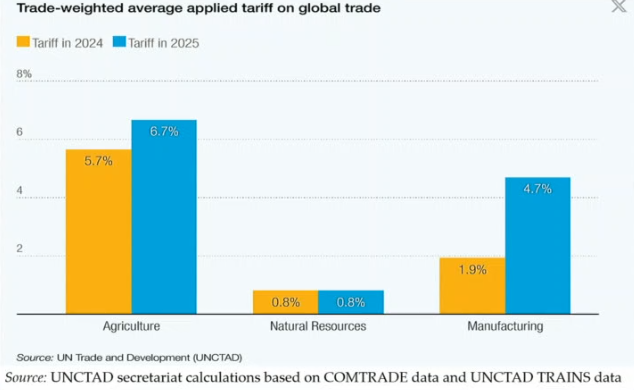 In 2025 there was a heightening because of DT, not that much right now. Obviously this impacted the average, as the USA trade a lot.
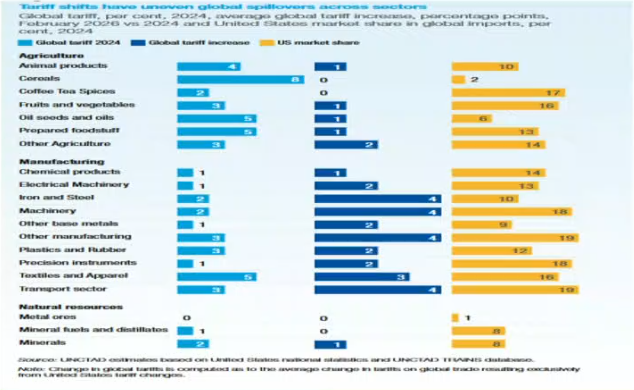 More impact in sectors where the US imports more. Countries are adapting their trade policy, thus this will change for 2026.
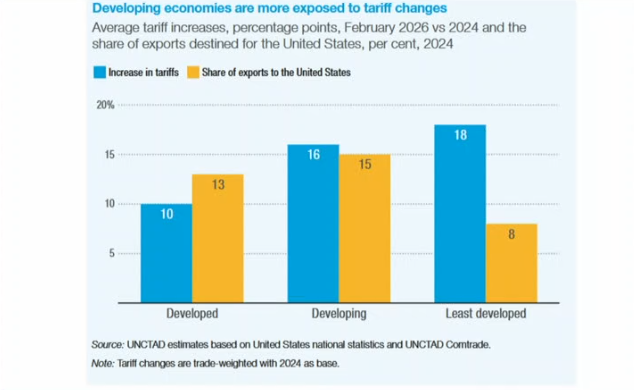 Developing economies are more exposed because of the type of good they export, primary ones. DT basically put tariffs on non-made in USA stuff.
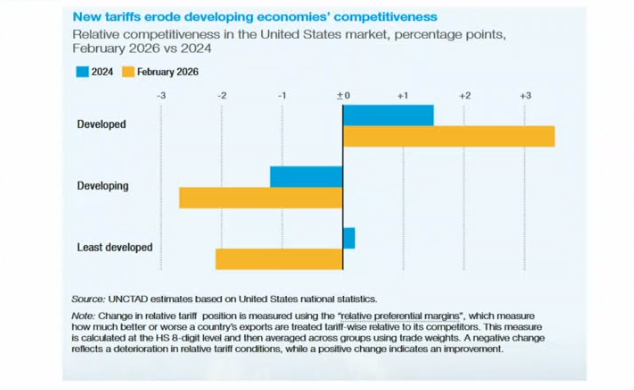 You can gain if you have less tariffs than your competitors, in a case where this is the opposite you lose: this is what happens to the developing. This doesn’t mean global trade doesn’t decrease.
So why?
- Why do we still observe positive tariffs while they could be highly distorsive?
- Tariff revenues = fiscal revenues of importance to several developing countries.
- It could be the most effective (not efficient) policy instrument to protect some domestic interests (producers –profits- + employees -employment).
- Protect industries until they (like East Asia did in the past) can compete internationally.
- Also a political thing.
- Tariffs are not the only trade policy instruments: NTMs and Subsidies.
- No revenue from international exchanges but (even if not that protective of national industries) can level competition. EU does this with tariffs and NTMs because its industries are constrained by specific regulations (for different reasons: e.g. protect animals) and increase production costs→costs of acquiring the product.
- Basically same logic that exists in use of tariffs.
Opposite
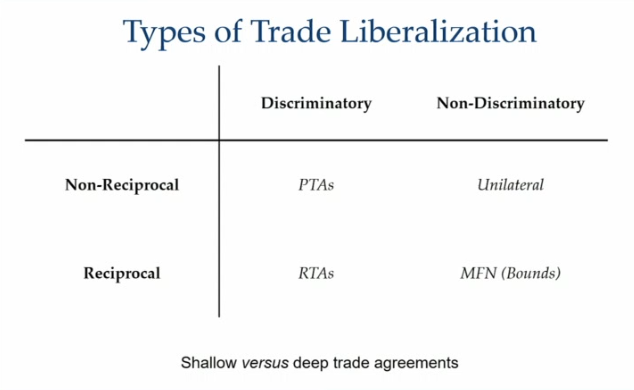 We have ways to protect trade, discriminatorily and non-discriminatorily (e.g. WTO where all members are bound and we only allow discriminatory treatments if it helps liberalise).
We used to only have shallow (no tariffs) instead of deep trade agreements that include other provisions like for investment.
Preferential trade agreements are the case for developing countries by most developed, among developing, or developed nations. Regional trade agreements can include stuff on investment.
Preferential and multilateral (WTO)
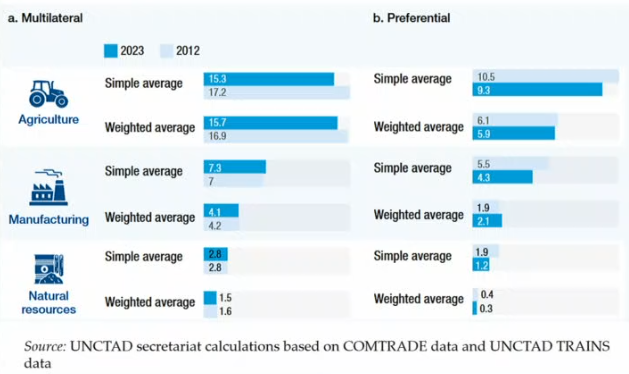 Some have also preferential treatments, most countries are in WTO though. Obviously less preferentials as it only makes sense if you get a better treatment than by just being in the WTO. Not much obstacle in natural resources as everyone needs them but when countries can afford it they block agriculture (tariffs or NTMs like subsidies) to reduce possibility of food insecurity.
Weighted average isn’t more appropriate, depends on the situation or context, but is different as it’s weighted by trade amount. If a country produces more manufactured goods they’ll apply less blockages so this affects the average when weighted (vs. less productive/competitive ones that feel the need to protect a bit).
Types of tariffs
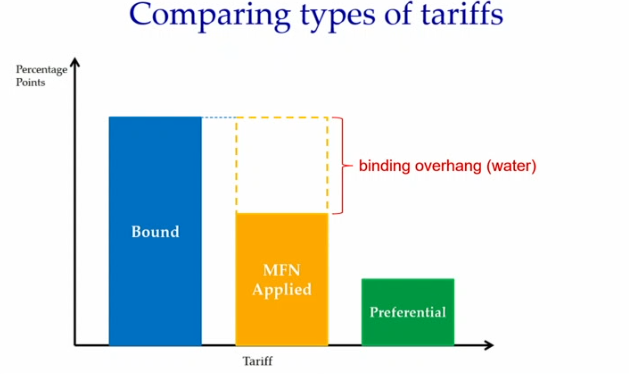 Bound tariffs are the maximum that you can apply (has to be the same to all, bound is negotiated and can be lowered. Since many are already well below (big water) they couldn’t care less they still have flexibility) to other WTO members without them being illegal. Isn’t always sanctioned though.
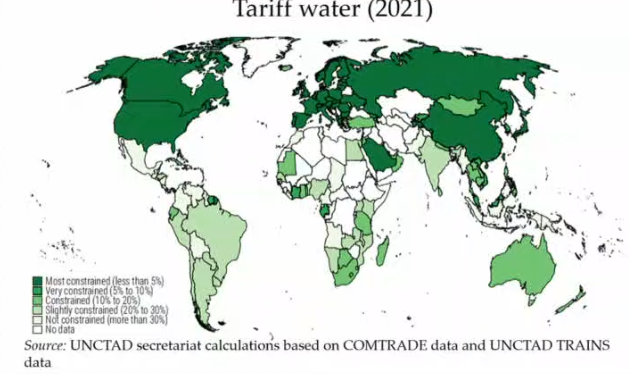 We see that most developed countries are very constrained, because of RTAs among other stuff.
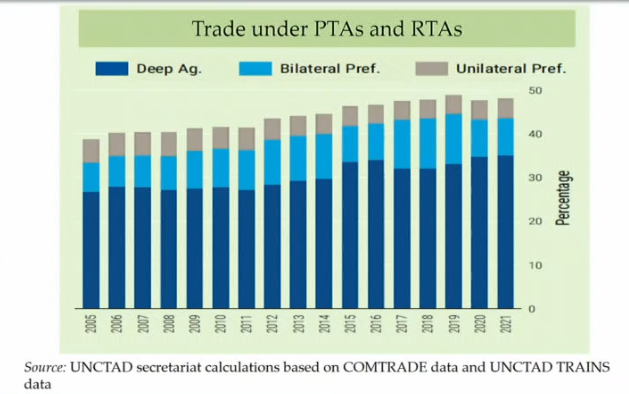 Until 2023 (even if not in the graph) about half of world trade was regulated by some kind of multilateral agreement. Now things have changed.
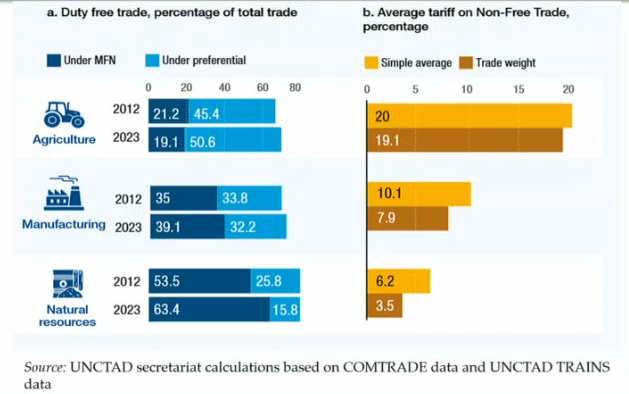 1/5 of trade is duty free in agriculture but way more in natural resources (here under MFN), same logic. This was in 2023, things have changed now. A lot of agricultural goods are duty free under some preferential treatment though. We can also see the average tariffs.
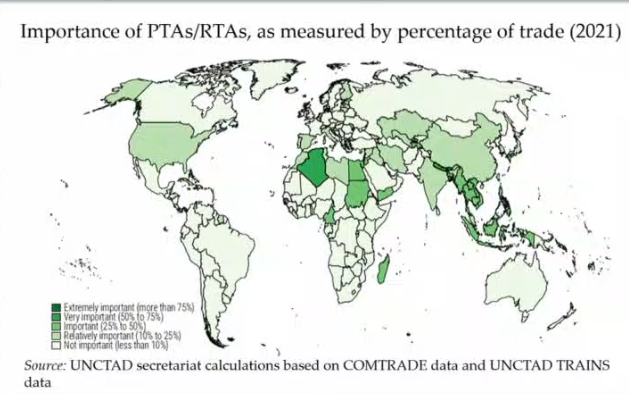 The project of the African Union still under negotiation but should come into force soon and impact this graph.
Forms of tariffs
-
Regardless of whether a tariff is bound or applied on preferential versus non- discriminatory basis, the tariff can take several forms.
-
The most common is an ad valorem tariff, which means that the customs duty is calculated as a percentage of the value of the product.
-
Many countries’ tariff schedules also include a variety of non ad valorem tariffs.
-
Specific tariffs are computed on the physical quantity of the good being imported.
- e.g., Australia’s 2005 schedule includes a tariff of 0.68 per live goat..
-
The physical quantity may be expressed in ways that are difficult to determine without laboratory equipment.
- The European Union charges duties on certain dairy products based on the weight of lactic matter in the product, and the United States charges a tariff on raw cane sugar that varies with the sucrose content of sugar: “1.4606 cents/kg less 0.020668 cents/kg for each degree under 100 degrees (and fractions of a degree in proportion) but not less than 0.943854 cents/kg.”.
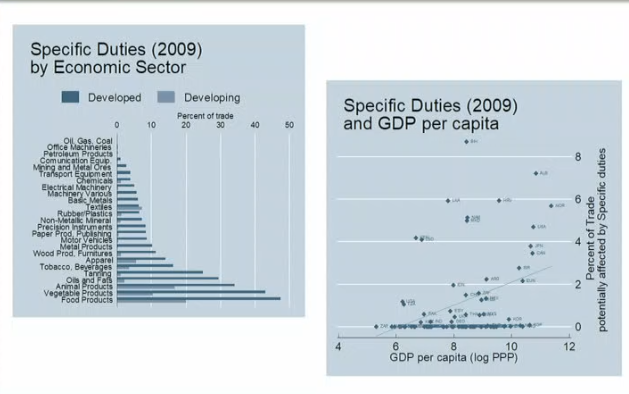 Developed countries use it more as you need good institutions and customs to actually carry out these computations on the import of goods.
- The European Union charges duties on certain dairy products based on the weight of lactic matter in the product, and the United States charges a tariff on raw cane sugar that varies with the sucrose content of sugar: “1.4606 cents/kg less 0.020668 cents/kg for each degree under 100 degrees (and fractions of a degree in proportion) but not less than 0.943854 cents/kg.”.
-
Import tariffs are not the only policy measures affecting international commodity trade.
-
Over the course of the past century, governments have expanded regulatory controls over economic activity, often in pursuit of social, public health, environmental, or other non-economic policy objectives.
- Like public or private standards (e.g: ISO. Private can often become public though)
-
As countries increasingly reduce tariff rates, these non- tariff measures can become more important.
-
It refers to any policy that interferes with exports or imports other than a simple tariff.
- NTB - Barriers (negotiated away).
- NTM - Measures (may be legitimate, some standards).
-
NTM: Policy measures, other than ordinary customs tariffs, that can potentially have an economic effect on international trade in goods, changing quantities traded, or prices or both.
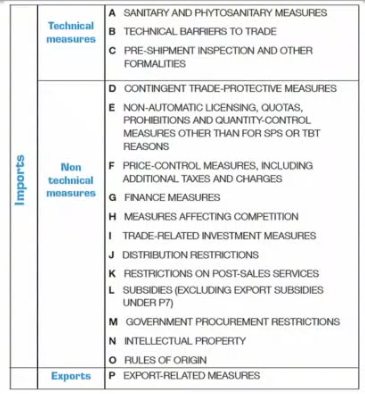
- Technical measures most important in the governance of global trade, doesn’t have blocking of trade as primary task→like maximum amount of pesticides in exported products or rules of origin like the US has tried to apply (2/3 of value addition in your country if you wanna export or no preferential treatment).
-
NTB: Policy measures that surely affect quantity traded and prices (subset of NTM that have discriminatory effects).
- Illegal.
-
NTB in WTO: Further subset of NTM.
Prevalence
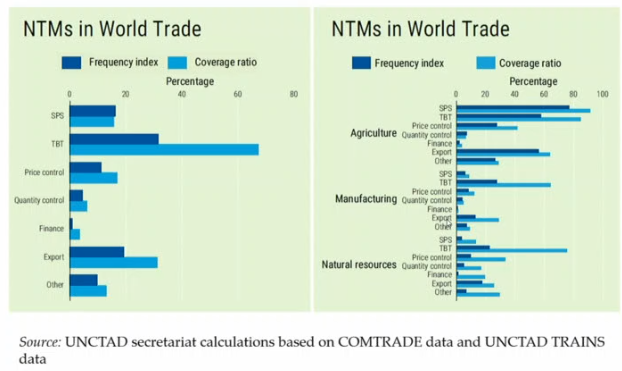 Frequency (share of the products) and coverage (share of the value of trade). Largest prevalence for technical measures (a lot of packaging regulations) and SPS. These are very present in agricultural goods. Lots of NTMs that impact trade of goods. Although most are non-discriminatory, measures apply also to domestic products.
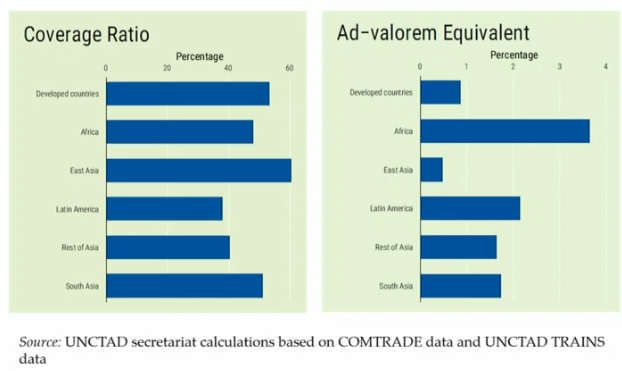 East Asia has a large share of imports therefore more coverage. We see how they impact the products in terms of value, as if they were a tariff. When a country is able to comply with these measures it gains a competitive advantage as the impact on trade is positive.
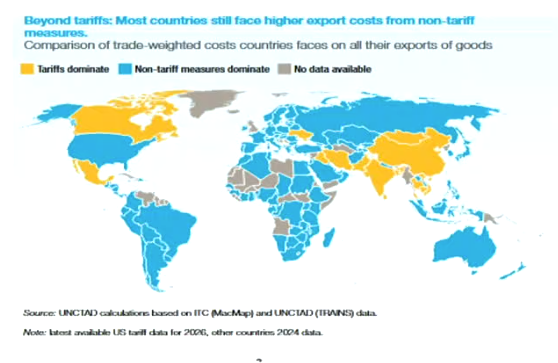 Many exporters face costs, mostly non-tariffs measures. They dominate, instead of tariffs. Only some exceptions. Although tariff equivalent translations are time-consuming and surrounded by methodological doubts, so maybe our approximations are not so correct.
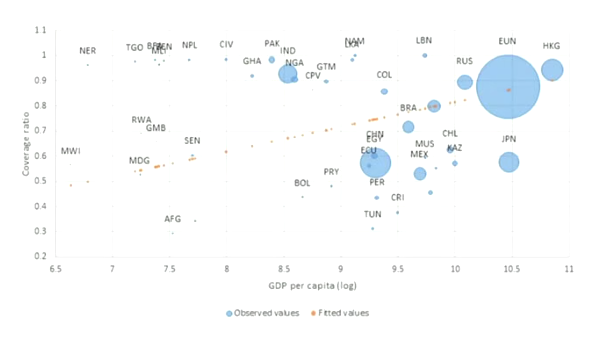 More GDP/capita=more coverage ratio (correlation-wise).
Subsidies
- Increase domestic production.
- Lower world prices.
- Cause distortions both on imports and exports.
- Subsidies vs border protection:
- A 10 percent tariff will always have a larger impact on world prices than a subsidy that provides an equivalent level of support.
- The reason is twofold: a) subsidies do not affect domestic consumption, while tariffs do by increasing consumer prices; and b) a larger share of subsidies does not directly affect prices as they are decoupled from production.
WTO
- Agricultural subsidies are grouped in one of three boxes (green, blue or amber) at the WTO, depending on the degree to which they distort trade:
- Green box subsidies are permitted because they are deemed to cause minimal distortion, and typically include those to research and development (R&D), environmental protection and animal welfare.
- Blue box subsidies are also permitted, but on the condition that they must not lead to increased production.
- We basically try to let farmers have a decent income.
- All domestic support considered to distort production and trade (with some exceptions) falls into the amber box, which is defined in Article 6 of the Agreement on Agriculture as all forms of domestic support except that placed in the blue and green boxes.
- Included in the amber box are measures to support prices, and subsidies directly related to production quantities.
- Amber-box support is subject to limits expressed in terms of a “Total Aggregate Measurement of Support” (Total AMS) which combines all supports for specified products, together with supports that are not for specific products, into one single figure.
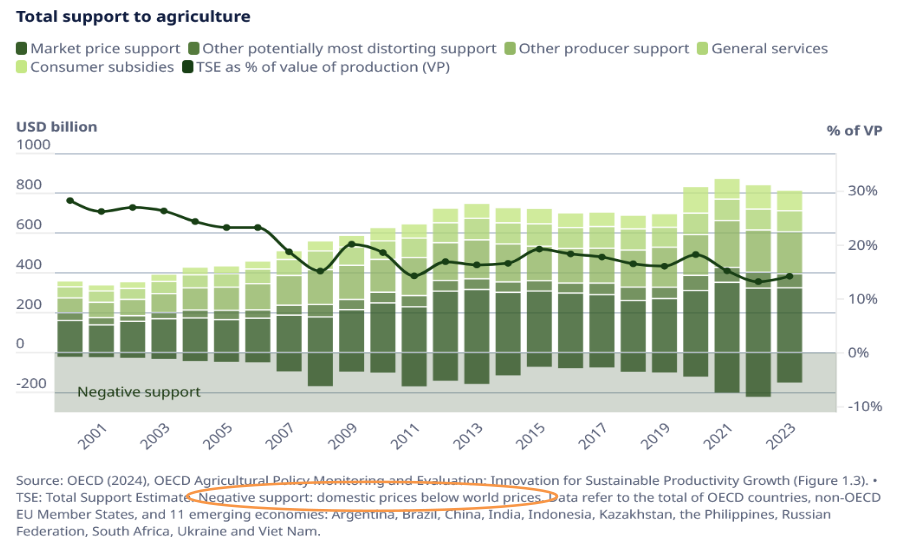 Pretty good coverage of info for OCDE as they have to give it, also other countries included. We see that there is even negative support, because of imposition of maximum prices in domestic markets. Consumers are the ones supported then. Support is lowering its levels relatively and not absolutely, some countries indeed support but then hurt on the side of price caps. Negative support growing.
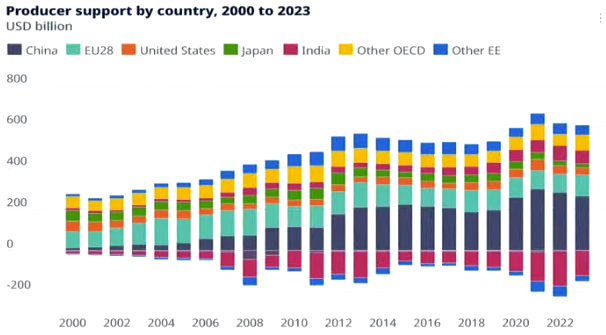 India growing into negative support.
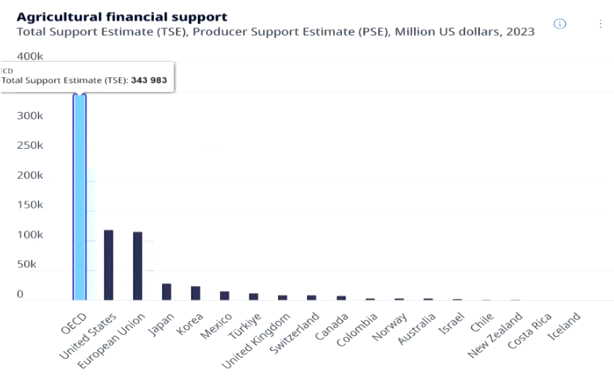
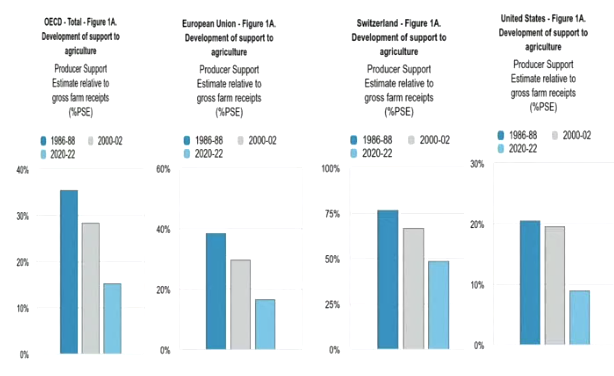 In the HC very very high. But decreasing everywhere. This doesn’t include indirect support such as NTMs.
Effects of tariffs
- A tariff (imposed by country A on imports from country B) creates a wedge between the price received by the foreign producers (country B) and the price paid by domestic consumers (country A).
- The tariff generates revenues: ad valorem tariff: tariff X imported value; specific tariff (on quantity): tariff X quantity; any combination of the two.
- Why imposing a tariff? promote domestic infant industries; protect domestic industries from foreign competitors (legal by WTO rules if unfair foreign competition or immediate competitive threat); raise fiscal revenues; reduce trade deficits; take advantage of an influent demand on international markets (terms of trade improvement): Welfare improving? No, not justified from a welfare point of view.
- Tax stuff a major concern for developing countries, they want the fiscal revenue.
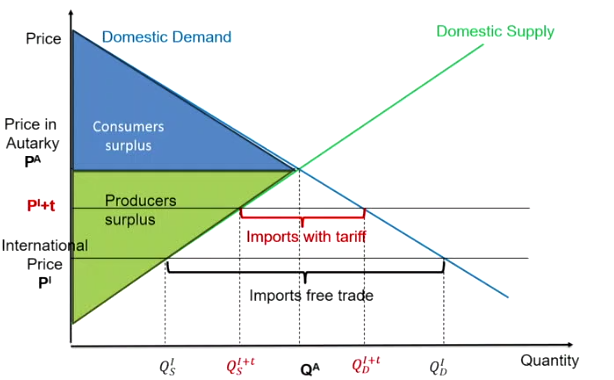 Allows domestic firms to be profitable as it brings the international price closer to the domestic one, firms that are foreign and do not have a low price could make negative profit and thus lose market access. Lowers imports as we can see. Domestic producers sell more.
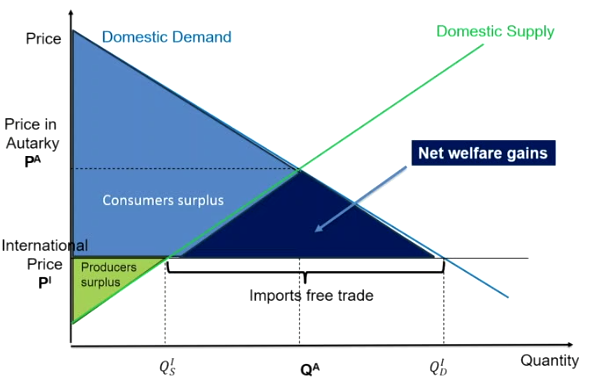 Here more consumers buy as prices are lower but producers sell less. There are tensions when it comes to who loses/wins, they want different things. Reality is more difficult though, some consumers are producers. Consumers see net welfare gains from free trade.
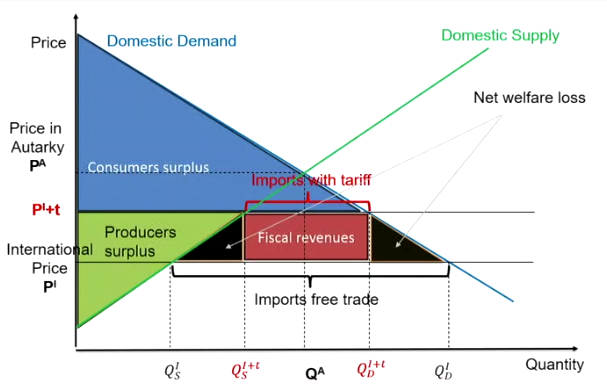 Fiscal revenues are generated but we also see a net welfare loss. Consumers pay more for the same good. Consumers and suppliers constantly react, this is inevitable… we create an artificial wedge. Maybe with some inelastic behaviour we could reduce it, but never get to perfection.
The formal decomposition between consumer losses, producer gains, tariff revenues, and deadweight loss is detailed in the welfare analysis of tariffs.
- Tax stuff a major concern for developing countries, they want the fiscal revenue.
Possible scenarios
- Total trade effect = trade creation + trade diversion.
- Trade creation: effect of absolute change in price of imports due to tariff.
- Trade diversion: effect of change in relative prices (additional trade creation).
- Trade deficit: Exports-Imports.
- Tariffs affect negatively imports: reduction in trade deficit; However, if retaliation by trade partners: reduction of exports : uncertain effect on trade deficit.
- Also, cost of inputs can increase. This leads to higher production costs for exports (produce less and/or sell less).
- In a static and theoretical world where countries only export final goods maybe this would be a good idea, alas… we don’t live there.
- Trade deficit = net inflow of goods and services : necessarily matched by net inflow of capital.
- If you aren’t attractive enough to get inflow of capital you can’t compensate for trade deficit. If you can’t keep up your debt you devalue your currency… Basically if there isn’t this match, the deficit is not sustainable.